Weakness in crop sector weighs further on farm finances
FarmIncome1-RFP-090825
Farm income and credit conditions deteriorated steadily throughout the Midwest and plains states in the second quarter of 2025 as profit opportunities in the crop sector remained weak. According to Federal Reserve Surveys of Agricultural Credit Conditions, farm borrower income and loan repayment rates deteriorated at a pace similar to last quarter. Weakness was most pronounced in regions heavily concentrated in crop production while strength in cattle and other livestock industries provided support to finances in some areas. Reduced working capital continued to drive higher demand for financing and interest rates on agricultural loans remained elevated. Farm real estate values declined slightly in some regions, but remained strong, which continued to bolster balance sheets and help limit financial stress for many producers.
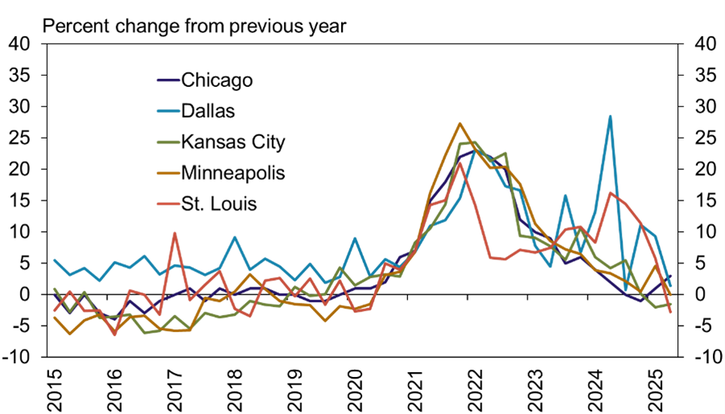
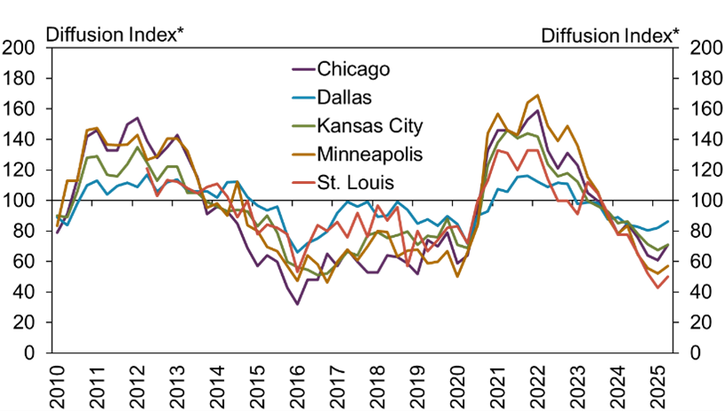
Farm financial conditions continued to deteriorate gradually as weak crop profits weighed on the sector. The pace of decline in farm income was similar to recent quarters in all participating districts (Chart 1). Weakness was more pronounced in the Minneapolis and St. Louis Districts, which are relatively more dependent on crop revenues than the Kansas City District where strong cattle prices have provided support in some areas.
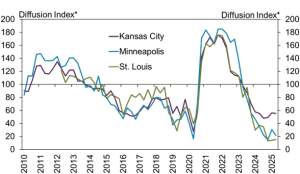
Weaker farm income has reduced liquidity for many producers and demand for financing continued to rise. Demand for non-real estate farm loans grew further in many regions and the pace of increase was comparatively faster in the Minneapolis District (Chart 2). Demand was nearly unchanged in the Dallas and St. Louis regions where the share of respondents indicating that demand was higher was equal to the share reporting lower demand.
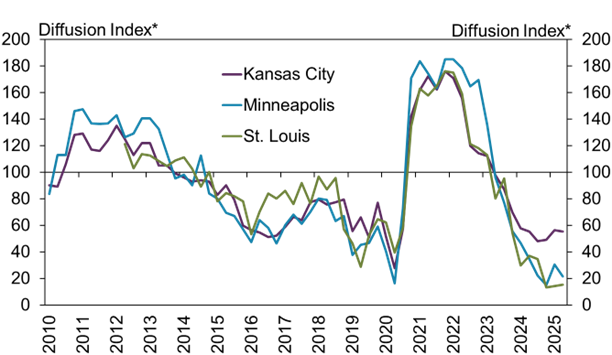
Along with weaker farm finances, agricultural credit conditions also continued to deteriorate. Farm loan repayment rates declined at a pace similar to recent quarters in all regions (Chart 3). Around 30% of respondents in the Chicago and Kansas City Districts reported that repayment rates were lower than a year ago while that share was around 40% and 50% in the Minneapolis and St. Louis regions, respectively.
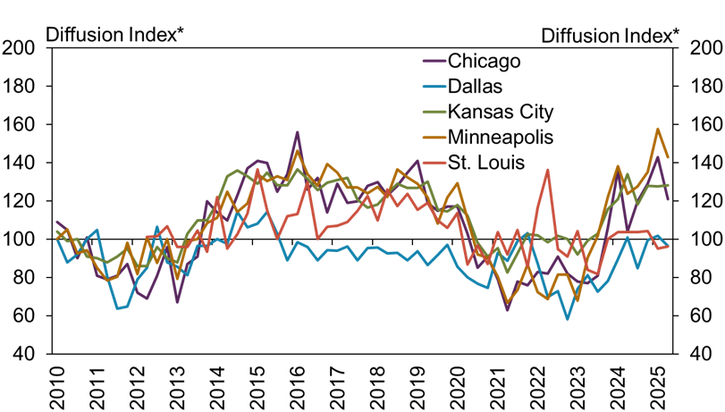
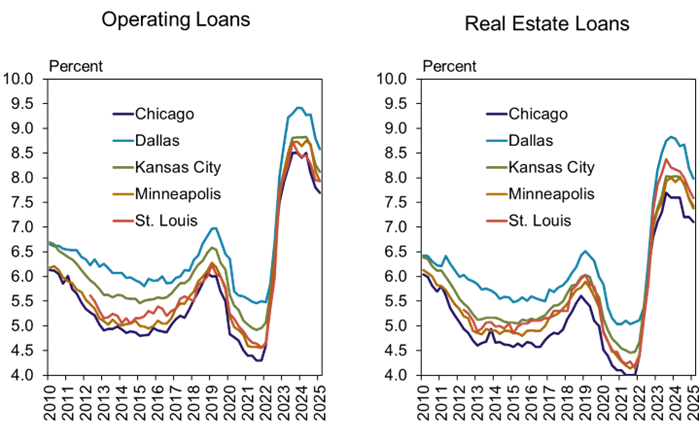
As credit conditions weakened, interest rates on farm loans remained above the recent historic average. Despite declining slightly in recent months, the average rate charged on both operating and real estate loans remained at least 160 basis points above the 15-year average in all districts (Chart 4). Similar to historic trends, average rates were comparatively higher in the Dallas District and lower in the Chicago District.
Farm real estate values remained strong, but continued to moderate. According to respondents, the value of nonirrigated cropland changed by less than 5% in all participating regions (Chart 5). Land values increased slightly in the Dallas and Chicago Districts and were modestly lower in all others.